My Elementor — new concept
A new data architecture and set of workspaces for My Elementor.
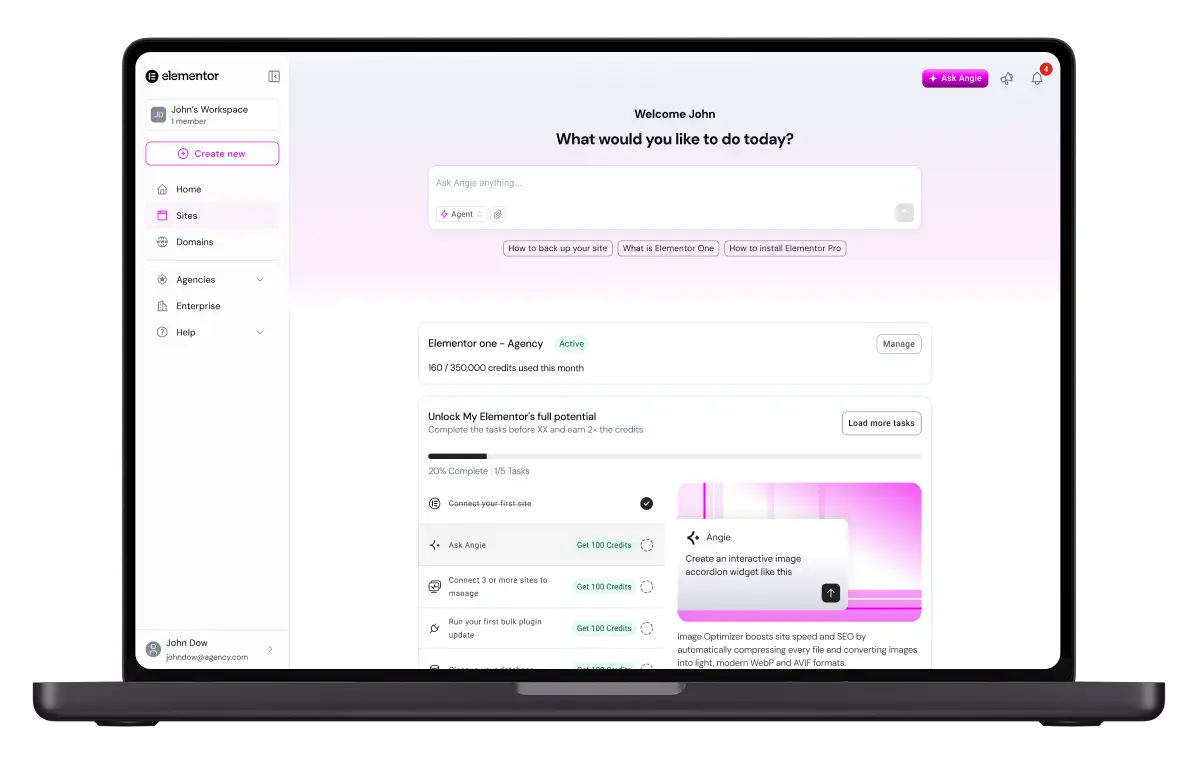
Home — landing surface, with an AI assistant prompt and connected sites front and center.
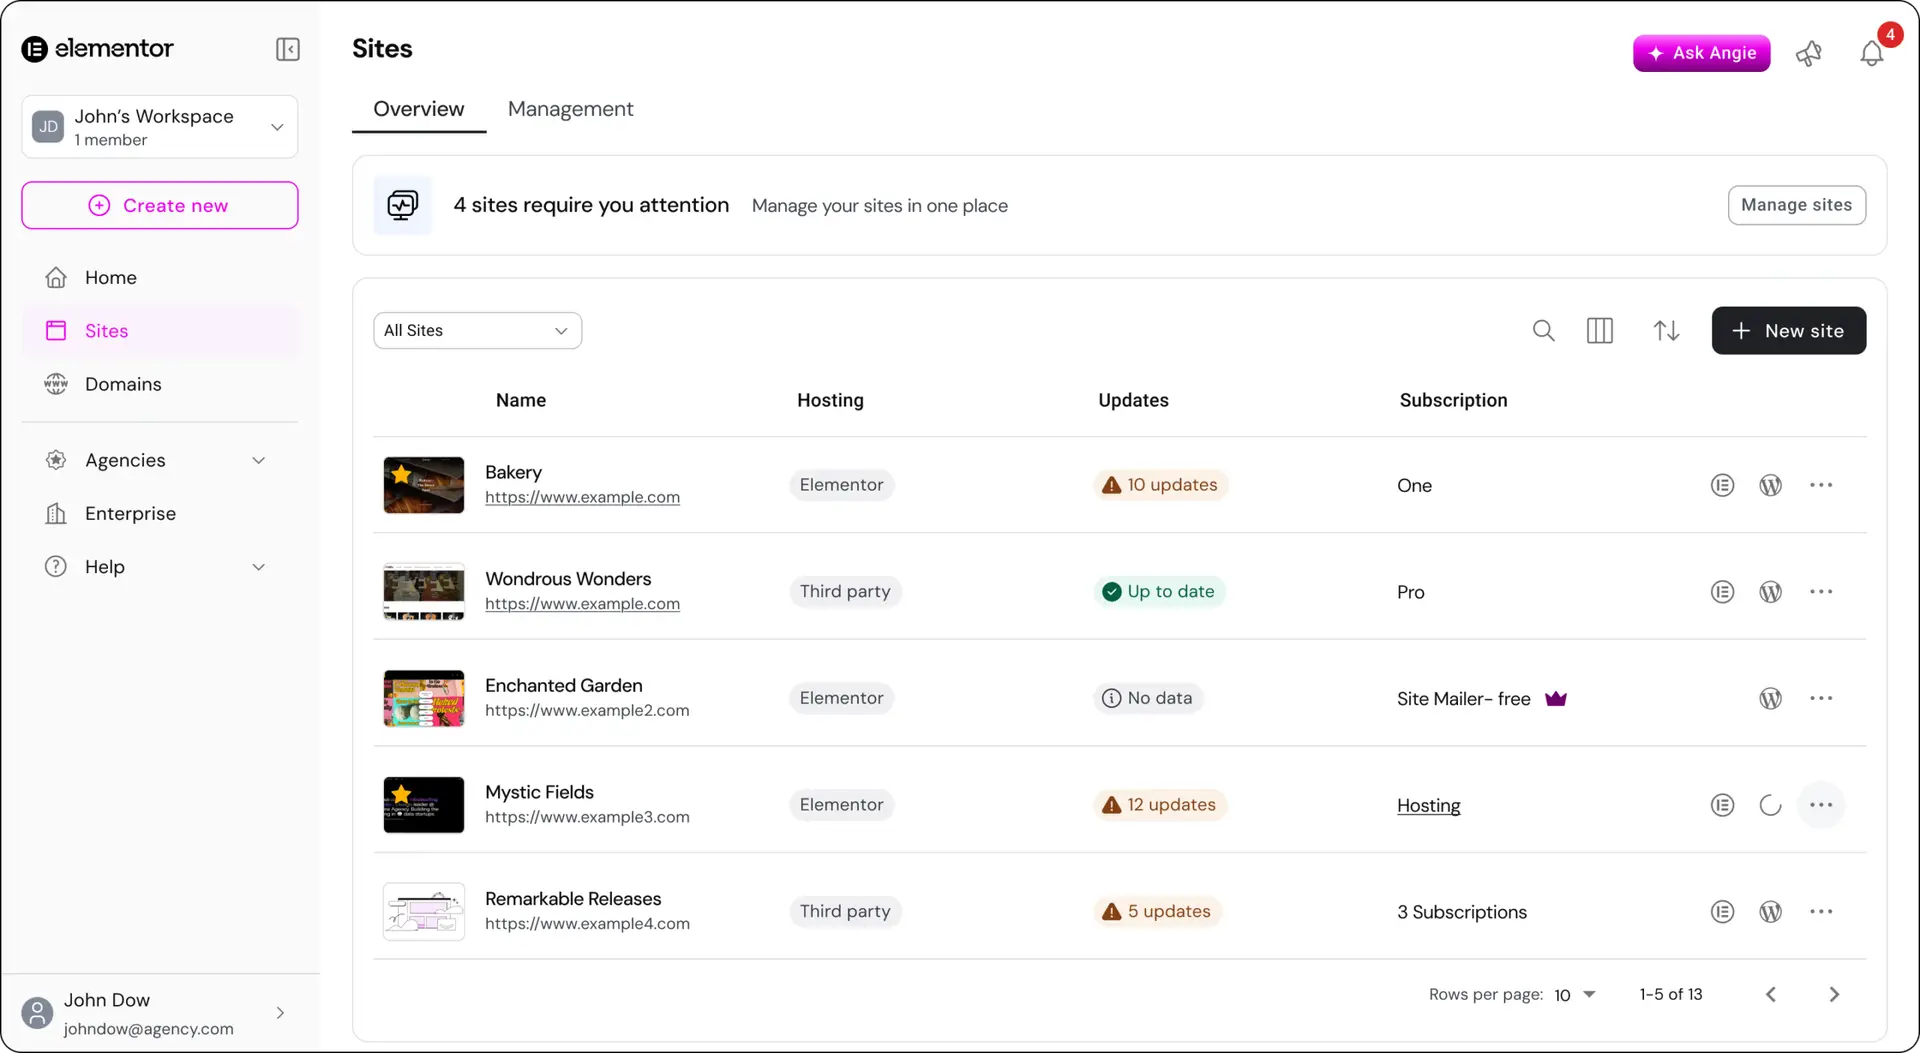
Sites, overview — a connected-sites table with performance, updates, and security status per row.
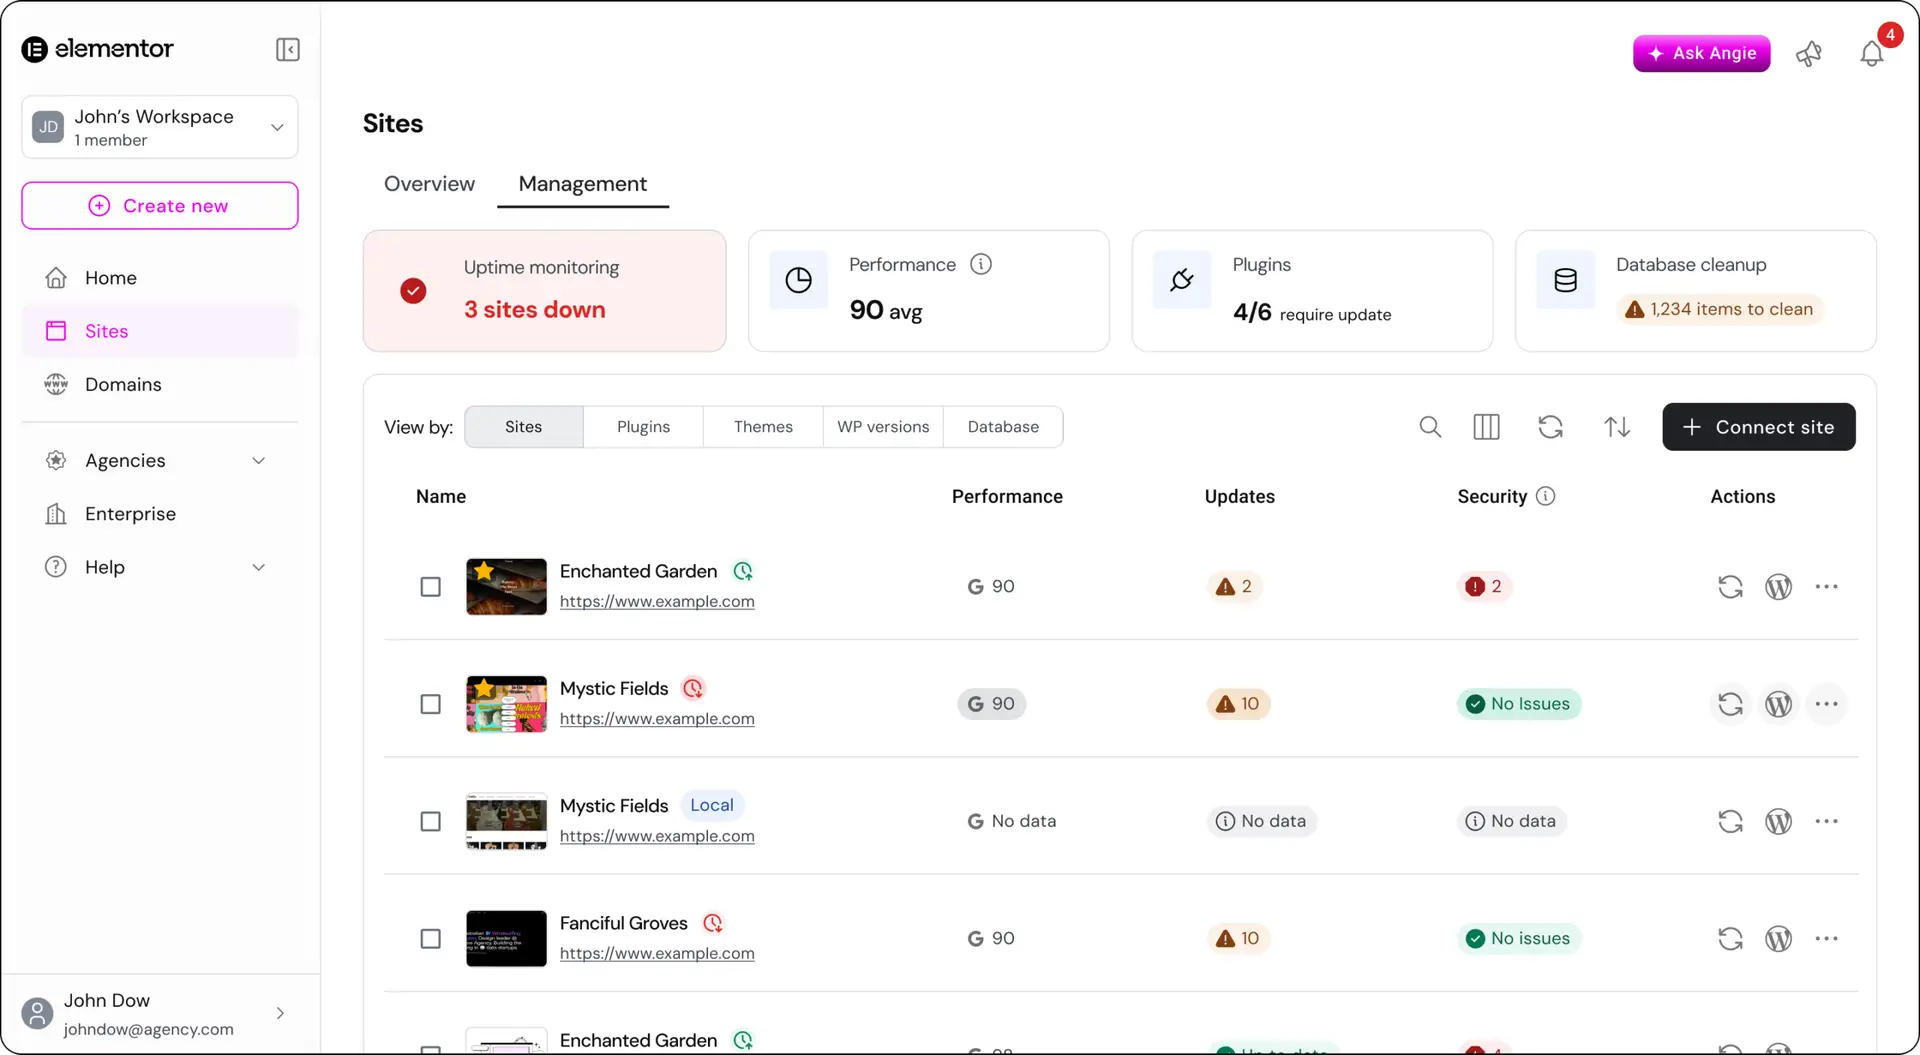
Sites, management — a bulk view across performance, updates, database, and security for every connected site.
Wiliot — new UI
Light and dark UI for the Wiliot platform, spanning a Gantt-style event chart, a lollipop chart, table design, and a bridge single page.
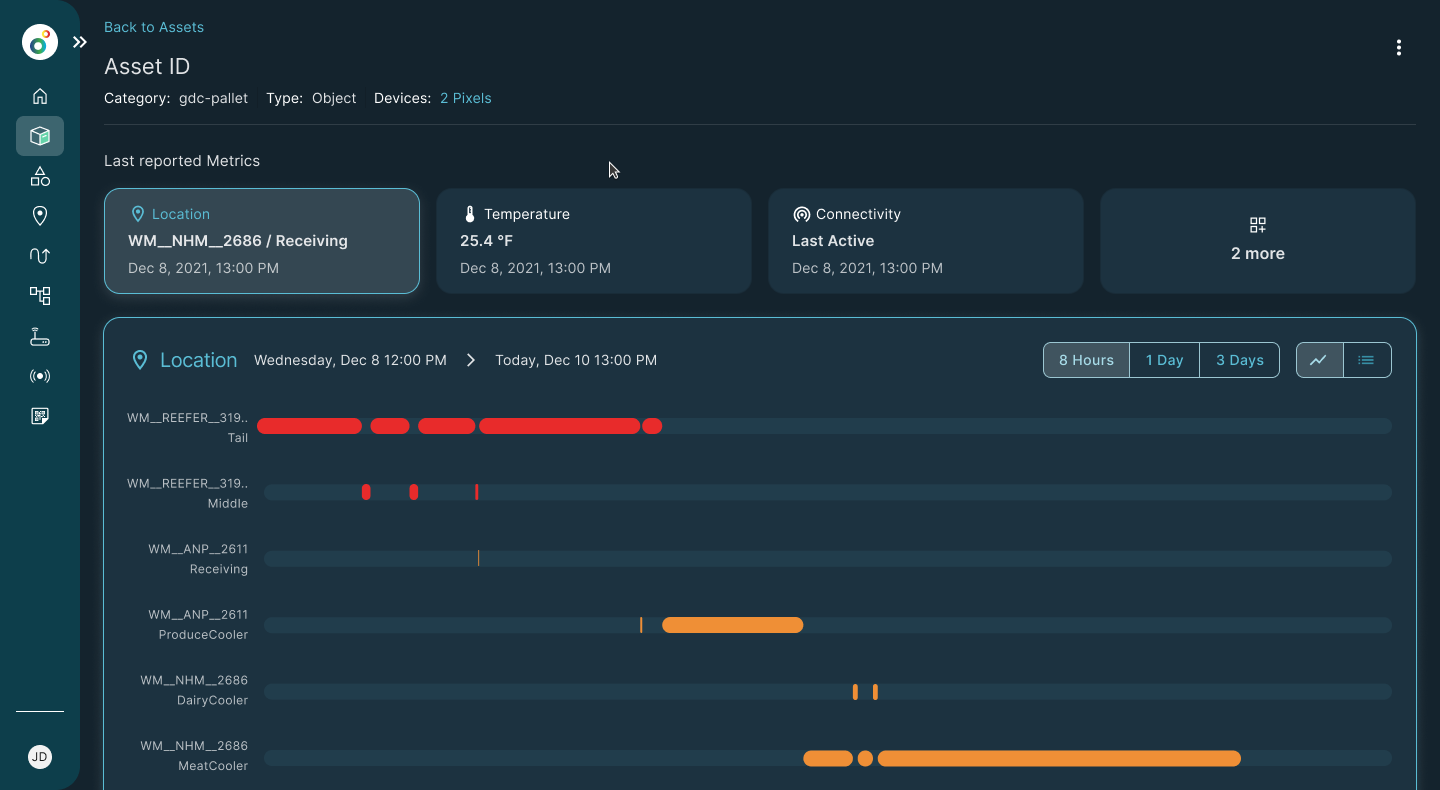
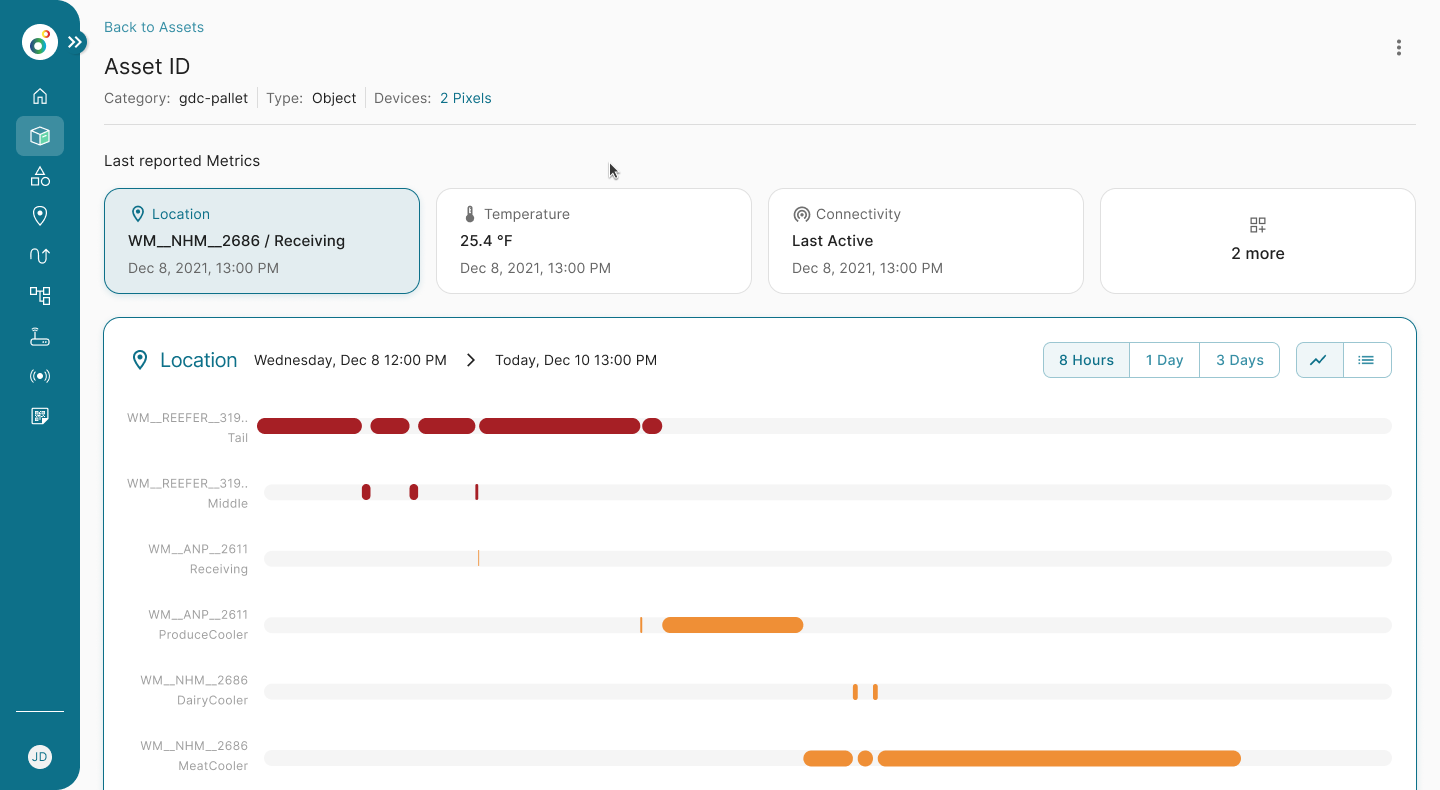
Gantt chart — per-device event bars over time, on an asset's detail page. Drag to compare light and dark.
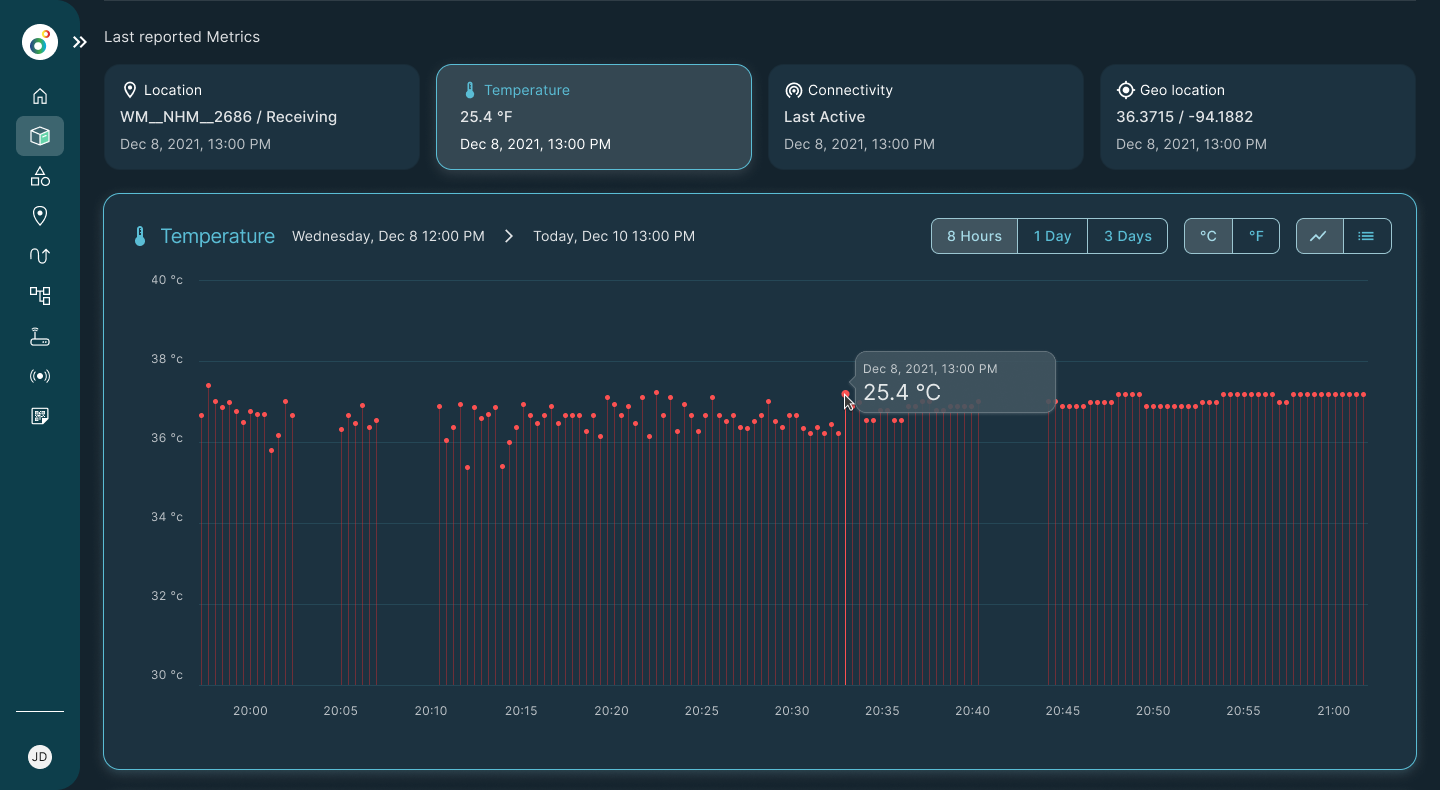
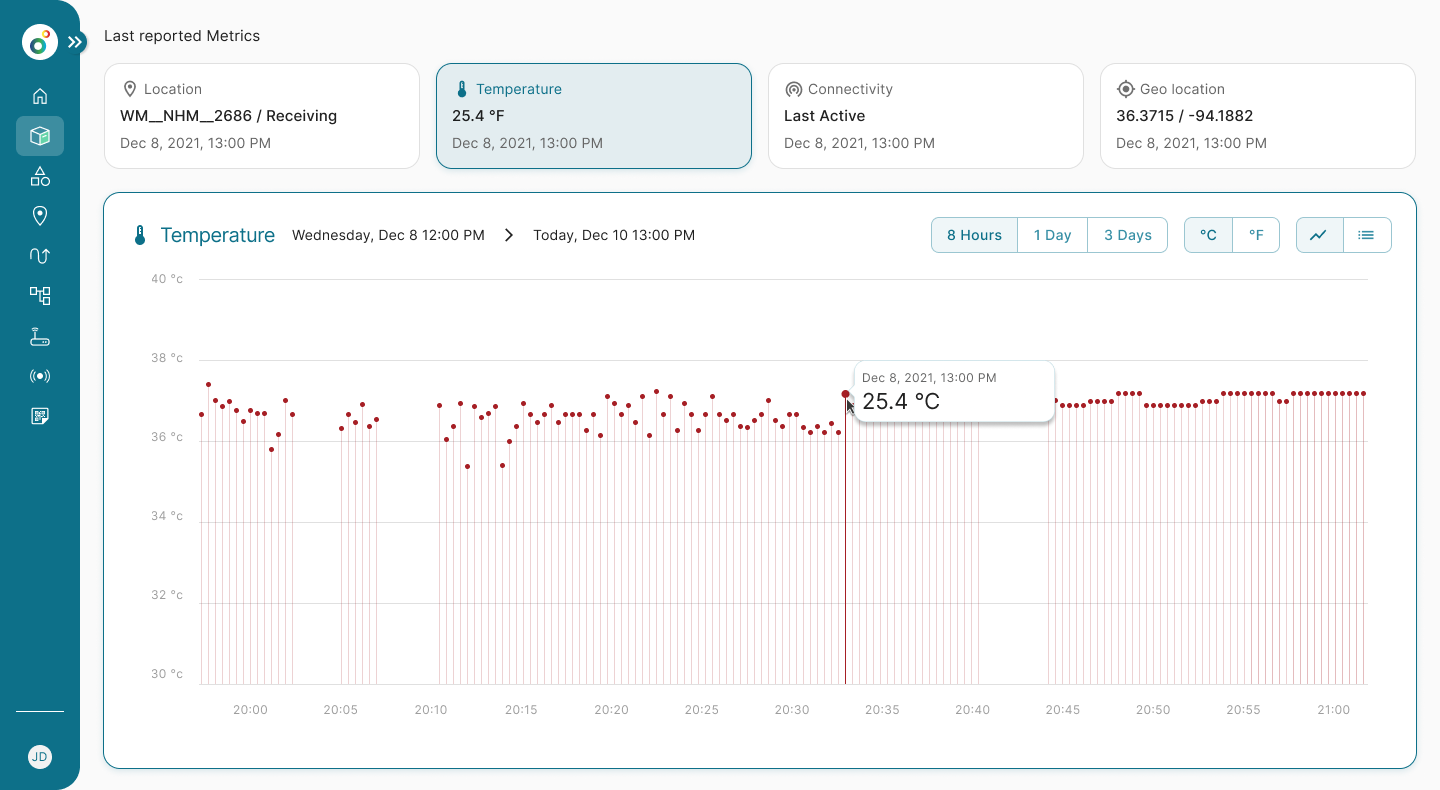
Lollipop chart — stem-and-dot readings for a single metric over time. Drag to compare light and dark.
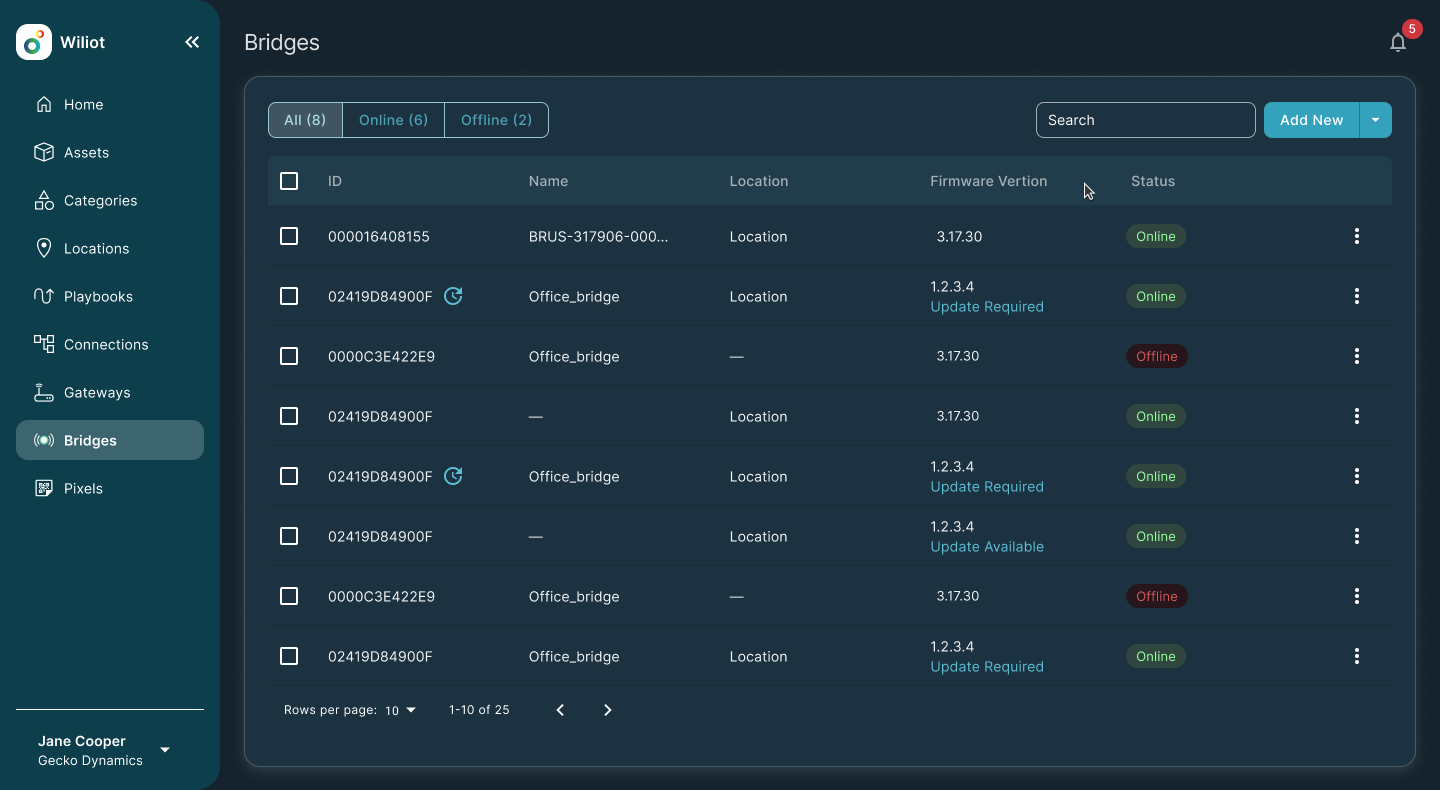
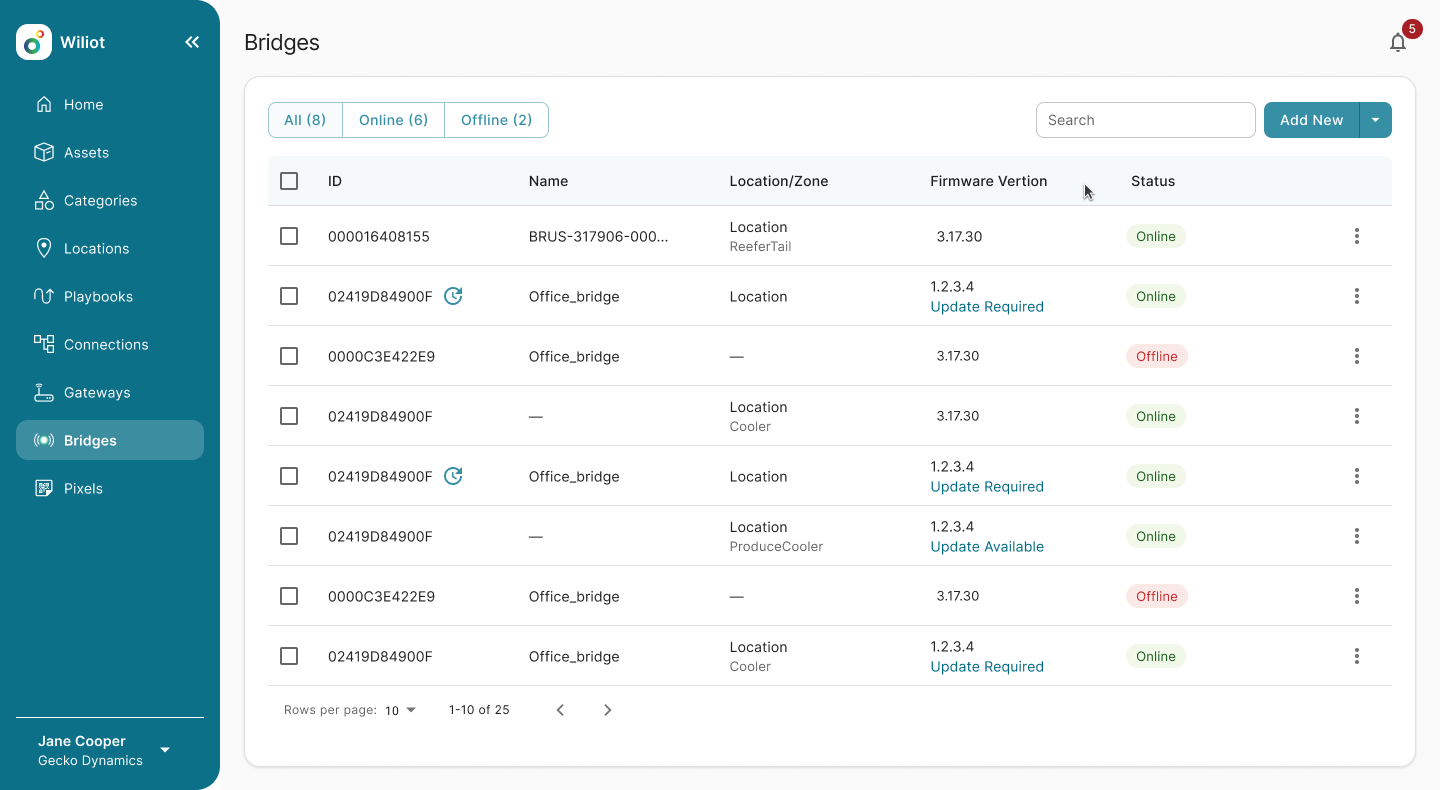
Table design — the bridges list, with status, firmware, and filters. Drag to compare light and dark.
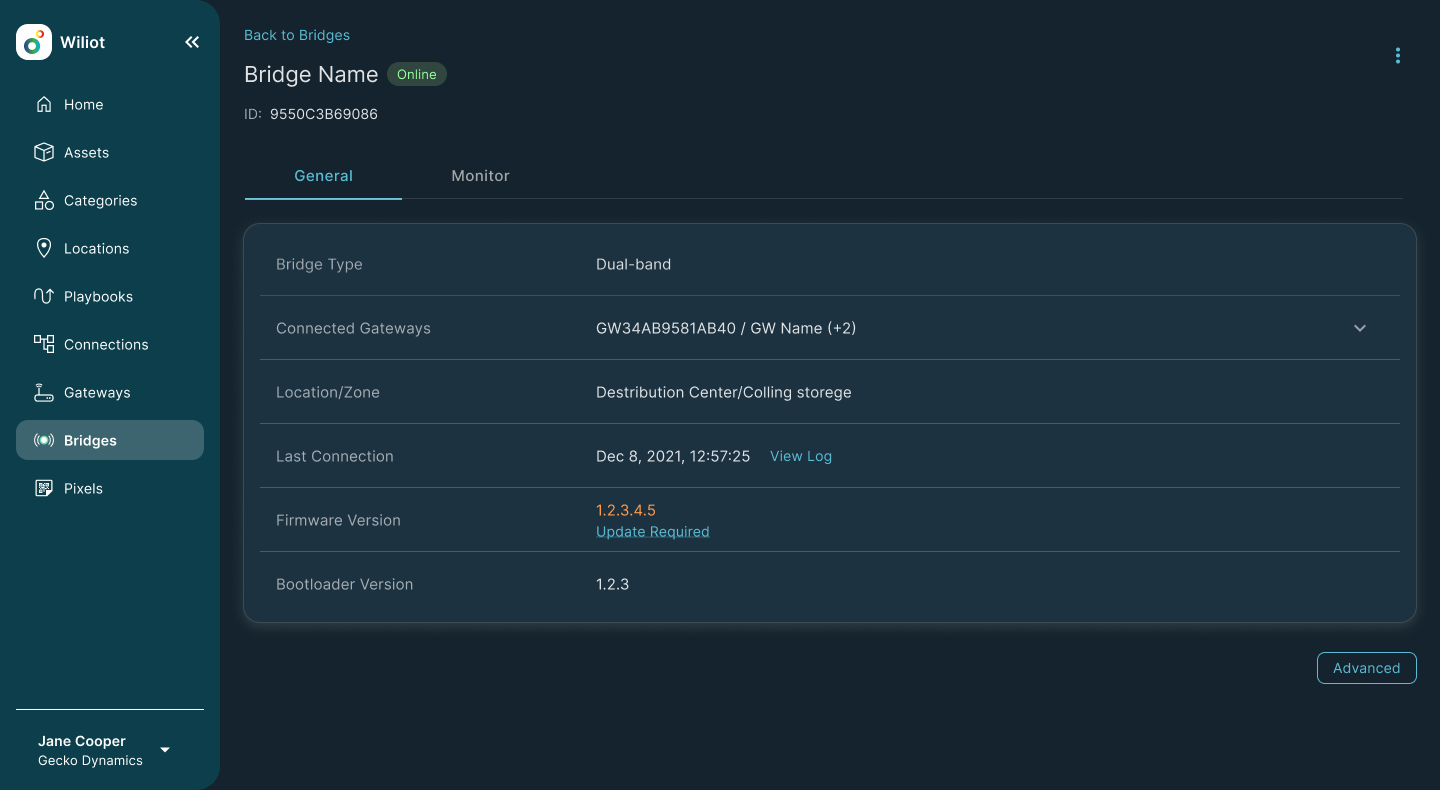
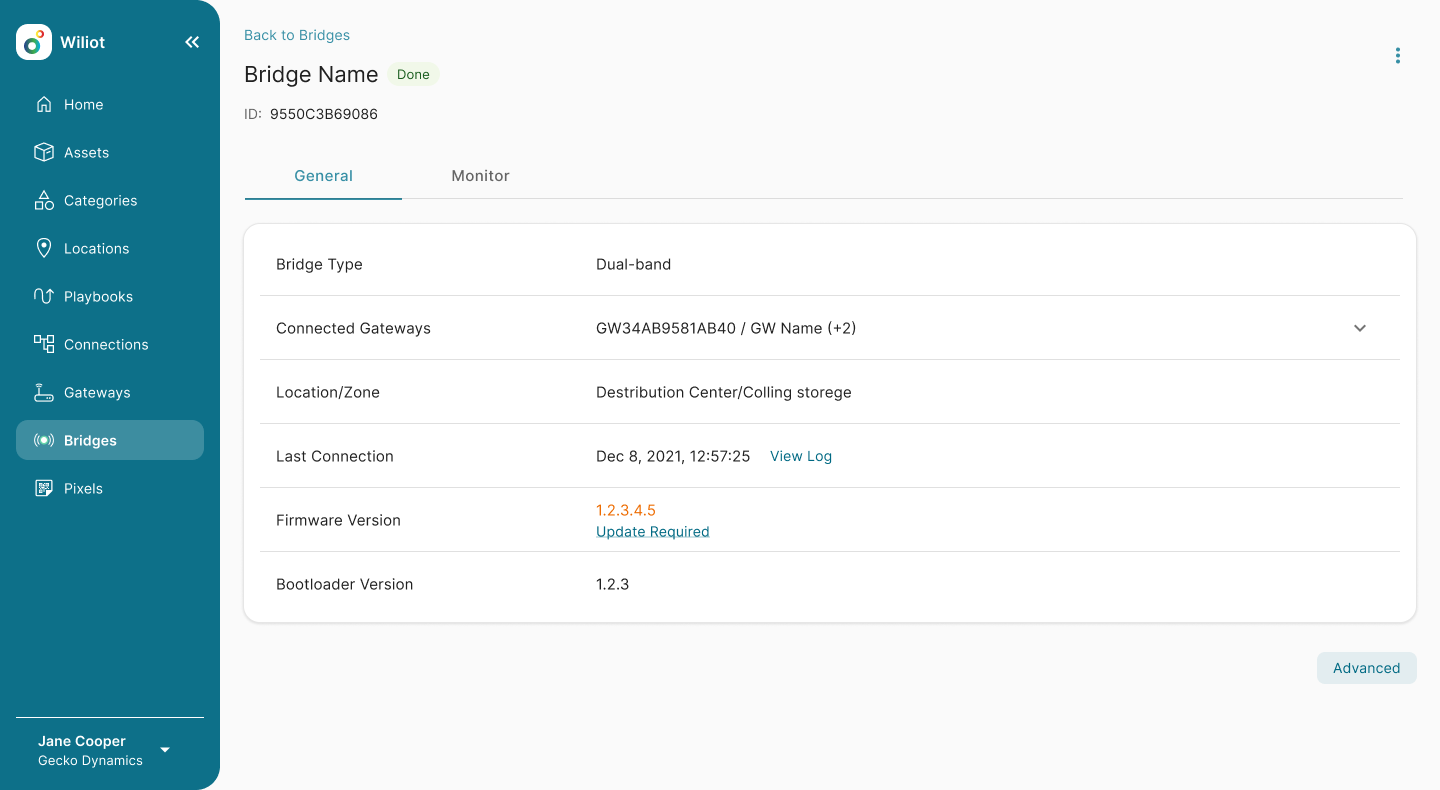
Bridge single page — a bridge's own detail view: type, connected gateways, location, firmware. Drag to compare light and dark.
Partner program flow
Wiliot app
A deployment app for creating assets and locations in the field.
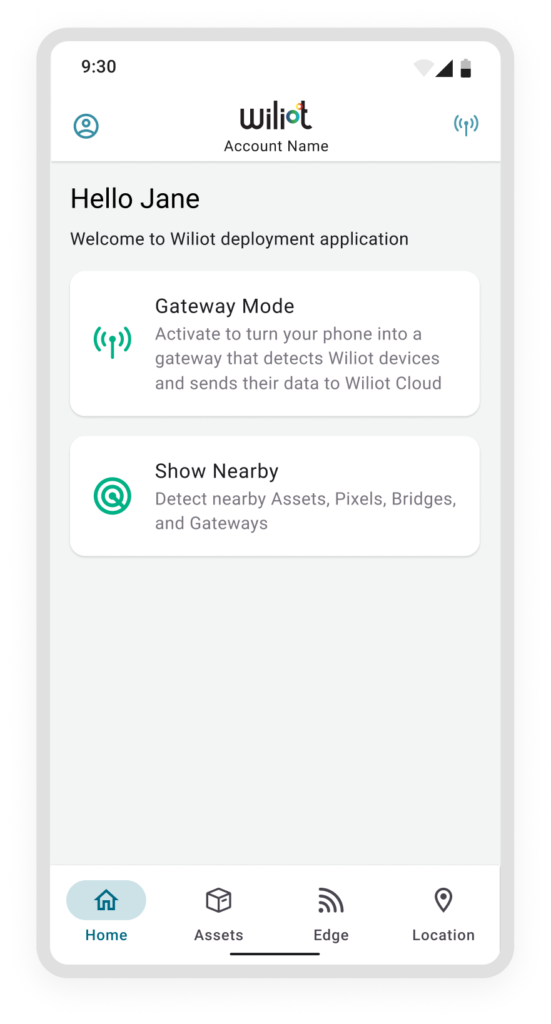
Home — Gateway Mode turns the phone itself into a Wiliot gateway, and Show Nearby detects nearby assets, pixels, bridges, and gateways.
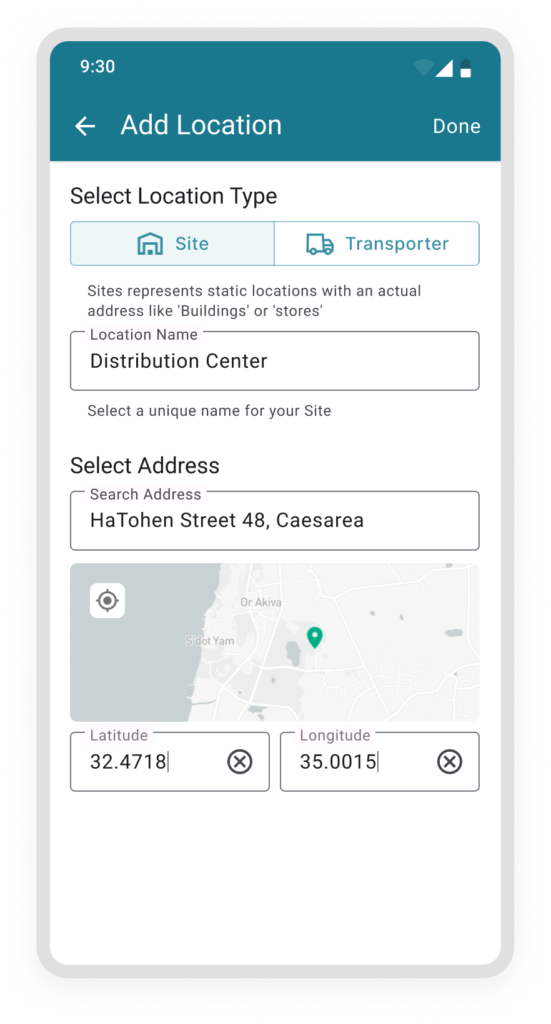
Add Location — naming a new site and placing it by address, with the pin dropped on a map.
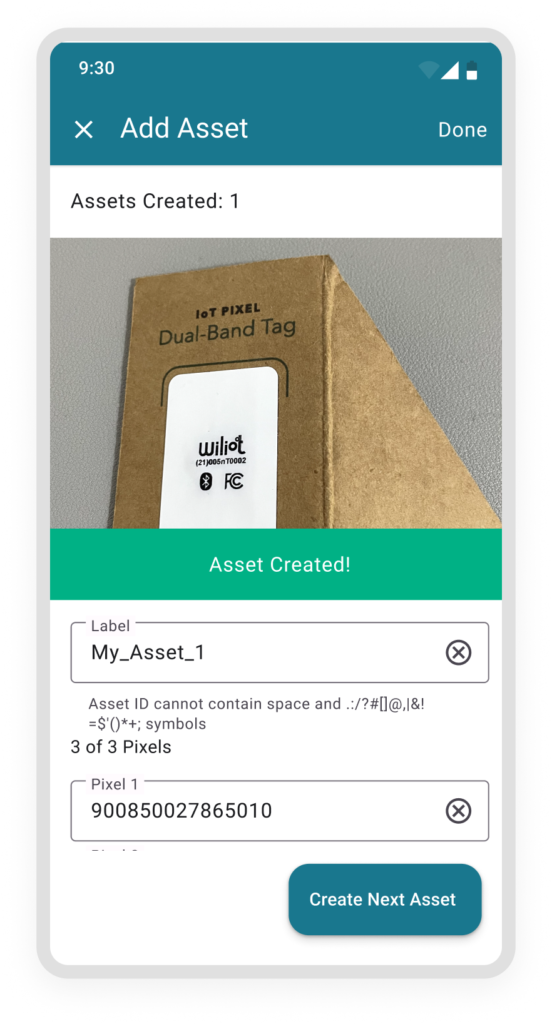
Add Asset — creating an asset by scanning its pixel tag, labeling it, then moving straight to the next one.